Predicting the Age of Crabs: A Machine Learning Approach
This repository contains a machine learning project focused on predicting the age of crabs based on various physical characteristics. The goal of this study is to develop a predictive model that can accurately estimate the age of crabs using features such as length, diameter, height, weight, and sex.
Overview
The dataset initially provided only included seven input features and a target column for prediction, which was not sufficient. To improve the predictive capabilities, feature engineering techniques were applied. Additionally, five different machine learning algorithms were utilized with their respective hyperparameters, and the best model for age prediction was determined. The model was then saved using the pickle library for future use.
Problem Statement
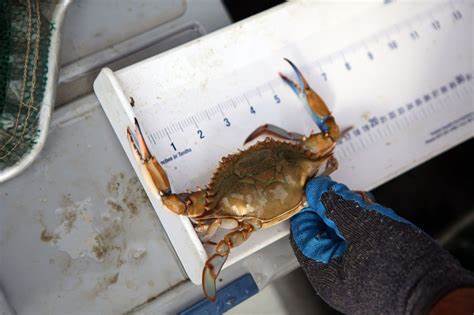
The objective of this project is to build a machine learning model that can accurately predict the age of crabs based on various physical measurements. The dataset contains information on the gender, weight, carapace length, carapace width, and abdomen width of crabs, as well as their actual age. The model should be able to take in these features as input and output a prediction of the crab’s age in years. This type of predictive model could be useful in the fishing and seafood industry, where the age of crabs is an important factor in determining their quality and market value.
Data Cleaning
Data cleaning steps were performed to prepare the dataset for analysis. Outliers were identified and removed using the interquartile range (IQR) method.
Exploratory Data Analysis
In this project, we conducted an Exploratory Data Analysis (EDA) to gain insights into the dataset and understand the relationship between various physical characteristics and crab age.
Scatter Plot: Relationship between Length and Age
Using a scatter plot, we explored the relationship between the length of the crab and its age. Although there appears to be a positive correlation, we cannot determine causality from the scatter plot alone.
Histogram: Distribution of Age
We generated a histogram to visualize the distribution of age. The histogram reveals a normal distribution of age in the dataset.
Violin Plot: Age by Sex
By using a violin plot, we examined the distribution of age based on the crab’s sex. The plot shows a bulge in the middle, indicating that the median age is more common than other values. This suggests that the distribution may be skewed towards the median or have more observations around it.
Box Plot: Distribution of Age by Sex
We created a box plot to compare the distribution of age between male and female crabs, as well as intermediate crabs. The box plots indicate that the median, quartiles, and outliers for male and female crabs are almost the same when compared to intermediate crabs.
Pairplot: Pairwise Relationships
The pairplot illustrates the pairwise relationships between the variables length, diameter, height, weight, and age, with the points colored by the sex variable. Upon examining the age pairwise with other columns, we observed better correlations between age and other features.
Heatmap: Correlation Matrix
Using a heatmap, we visualized the correlation matrix to measure the linear relationship between different features and crab age. The heatmap highlights that shell weight and diameter have the highest correlation with age.
The EDA provided valuable insights into the dataset, allowing us to identify potential relationships and important features for predicting the age of crabs.
Feature Engineering
Feature engineering techniques were applied to create additional features that could enhance the predictive performance of the models. This included the calculation of the body mass index (BMI), ratios of different measurements, interactions between measurements, and polynomial features. These new features were incorporated into the models to capture complex patterns and relationships.
Best Model Selection
Five different machine learning algorithms were trained and evaluated using appropriate evaluation metrics such as mean absolute error, mean squared error, and R-squared. The performance of each model was compared, and the random forest algorithm was found to provide the best performance with an R-squared value of 0.58.
Experiments
In order to find the best regression model that fits the data with the highest accuracy, we trained and evaluated five different regression algorithms. The algorithms used, along with their best parameters and corresponding scores, are summarized below:
| Model | Best Parameters | Best Score |
|---|---|---|
| LinearRegression | {‘max_depth’: 10, ’n_estimators’: 500} | 0.590137 |
| RandomForest | {‘regressor__max_depth’: 5, ‘regressor__n_estimators’:… | 0.578481 } |
| Ridge | {‘regressor__alpha’: 1} | 0.576431 |
| SVR | {‘regressor__C’: 1, ‘regressor__kernel’: ‘rbf’} | 0.575149 |
| Lasso | {‘regressor__alpha’: 0.01} | 0.570413 |
| DecisionTree | {‘regressor__max_depth’: 5} | 0.506982 |
For each algorithm, we fine-tuned the parameters to achieve the best performance. The model with the highest score was determined to be the best model for the given dataset.
By comparing the scores, we found that the Random Forest algorithm performed the best with a score of 0.578481. This algorithm with the specified parameters is recommended for regression tasks on similar datasets.
Single Input Prediction
In addition to training regression models on the dataset, we also developed functionality to predict the age of a crab using a single input. This feature can be useful when you have limited information about a crab and want to estimate its age based on its physical characteristics.
To use the single input prediction feature, follow these steps:
Prepare the input data: Gather the necessary physical characteristics of the crab for which you want to predict the age.
Load the trained regression model: Make sure you have the trained regression model, which has been optimized for age prediction based on the given dataset.
Input the data: Provide the physical characteristics of the crab as input to the regression model.
Obtain the predicted age: The model will process the input and provide a predicted age for the crab based on its physical characteristics.
By utilizing this single input prediction functionality, you can quickly estimate the age of a crab without relying on a large dataset. However, please note that the accuracy of the prediction may vary depending on the quality and completeness of the input data.
Feel free to experiment with different inputs and explore how the model responds to variations in the crab’s physical characteristics.
Conclusion
The developed machine learning model using the random forest algorithm demonstrated the potential to accurately predict the age of crabs based on physical characteristics. However, further improvements can be made to enhance the model’s accuracy. The project highlights the application of machine learning techniques in predicting crab age and their potential use in the fishing and seafood industry.
Future Work
- Further fine-tuning of the model’s hyperparameters to improve prediction accuracy.
- Experimenting with additional feature engineering techniques to capture more complex relationships.
- Collecting additional data to expand the dataset and enhance the model’s generalizability.
Credits
This project was developed by Aravinth Meganathan. If you have any questions or suggestions, please feel free to contact me.
Feedback
Your feedback is important to me! If you have any suggestions, questions, or feedback regarding this project, please feel free to reach out to me at:
- Email: [aravinthmegnath@gmail.com]

I appreciate your valuable input and look forward to hearing from you!